


Earnings will need to be the catalyst to push the market higher
Review the latest Weekly Headings by CIO Larry Adam.
Key Takeaways
- Equity market technicals are currently stretched
- Election uncertainty likely to weigh on the market near term
- Earnings will need to be the catalyst to push the market higher
Another Super Moon! This week, skywatchers got to experience the Hunter’s Moon – the third of four Super Moons this year. With the earth reaching its nearest point to the moon, the Super Hunter’s Moon is the biggest and brightest of the year. And speaking of bright shining things, the S&P 500 is on track to deliver its second consecutive year of 20+% returns – a milestone it has not achieved since 1998, the last time the U.S. economy simultaneously experienced a soft landing and tech revolution. The S&P 500 is also on pace to deliver its strongest performance leading into an election year since 1932. With the strong gains pushing the S&P 500 up to our 12-month (Sept 2025) target of 5,850, it begs the question: is our 12-month forecast too low? Right now, we do not think so. However, below we discuss our rationale for why we remain cautious in the near term and discuss what conditions we would need to see in the coming months that would lead us to be more optimistic (and therefore raise our target) on the equity market longer term:
- Curbing Our Near-Term Equity Enthusiasm | With the S&P 500 near record highs, below are four reasons to be cautious in the near term.
- Technicals Are Getting Stretched: The S&P 500 is on track for its sixth straight week of gains. If the S&P 500 closes above 5,815 at the end of the week—it will mark the longest weekly streak of gains year-to-date. However, with the market’s recent gains, the technicals are getting stretched. First, the S&P 500’s put/call ratio (a measure of market sentiment) is at its lowest level since mid-2023 and in the 10th percentile vs. history—suggesting investors see limited downside risks to stock prices. Second, the 14-day RSI is nearly in overbought territory (a level above 70) for the first time since mid-July. These technical measures, often viewed as contrarian indicators, suggest the market may be ripe for a period of consolidation or vulnerable to a near-term pullback.
- Investors Are Overly Optimistic: With a soft landing now the consensus view on Wall Street, investor optimism on the stock market has reached lofty levels. This can be seen across multiple different surveys. For example, in the AAII Investor Sentiment Survey, the percentage of investors that are bullish has climbed from 39% in mid-September to a peak of 49.6% in the last few weeks. While yesterday’s weekly survey showed some moderation in investors’ bullishness, with optimism about stocks dropping to 45.5%—bullish sentiment remains well above its historical average of 37.5%. In addition, that same survey (and echoed by other industry reports) shows that investors’ allocations to stocks have risen sharply over the last few months—now hovering near the highest percentage weighting (~70%) in the last 20 years. Historically, when investor sentiment gets this extended, near-term caution is warranted.
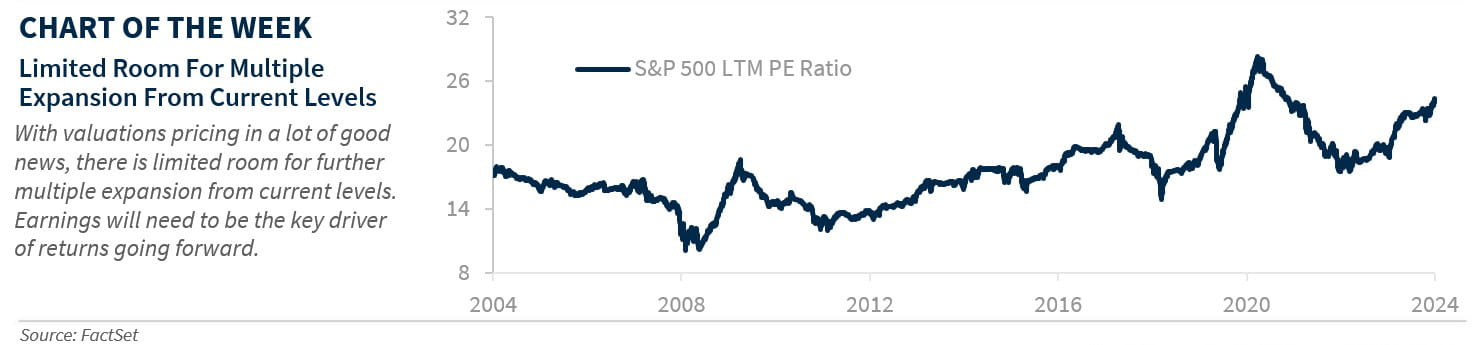
- Elevated Valuations: A lot of good news (e.g., soft landing, aggressive Fed cuts, moderating inflation) has already been priced into the market. This is reflected in the S&P 500’s LTM P/E multiple, which is currently trading at its most expensive level ex-COVID (24.3x) in more than 20 years—in its 95th percentile relative to history. With such lofty valuations, the scope for significant multiple expansion to drive stock prices higher from today’s levels is limited. In fact, such elevated valuations could leave the S&P 500 vulnerable to any disappointing economic or earnings news. While still early in earnings season, companies that missed estimates are underperforming.
- Election Uncertainty: The S&P 500 is on track for its best three-month return ahead of the election, thus far climbing ~12% during this window. While this has historically favored the incumbent party, former President Trump has been gaining momentum in the polls. But given the margin of error, the race remains too close to call. With only 18 days to go to the election, the next few weeks could bring considerable political uncertainty that could impact the market. Case in point: we may not know the winner of the election on November 5. Using 2020 as a guide, it could be days or even weeks before the certified count is in. This uncertainty, particularly if there are legal challenges, could lead to an uptick in volatility. There will be much to contend with in the post-election environment: the potential impact of tariffs (Trump), the expiration of the tax cuts (Harris), the burgeoning national debt (both) and an increased risk of a government shutdown (assuming split government)—risks that are not fully priced in but will increasingly come into the market’s focus.
- What We Need To See To Turn More Optimistic | With valuations stretched, earnings will need to drive the market higher from here. This is consistent with history as P/E multiples typically contract 7-10%, on average, in the third year of a bull market, with earnings the key driver. While 3Q24 earnings season is off to a solid start (companies are beating by an above-average 7%), forward-looking estimates for 4Q and 2025 earnings are moving lower. Full-year 2025 has been revised lower over the last three weeks and are now at the lowest level since early-April. With our 2025 EPS estimate already below consensus at $265 (consensus: $274), implying roughly 8-10% EPS growth over 2024, we need to hear solid forward-looking guidance from management teams before considering raising our 2025 EPS estimate or 12-month equity target. Fortunately, the next two weeks will provide some answers as 55% of the S&P 500 market cap will be reporting. We will be monitoring whether AI demand remains solid, how consumers are faring after the recent soft patch and is the economy leading to a broadening in EPS growth. We will need to see strength in these areas before upgrading our 12-month S&P 500 target.
All expressions of opinion reflect the judgment of the author(s) and the Investment Strategy Committee, and are subject to change. This information should not be construed as a recommendation. The foregoing content is subject to change at any time without notice. Content provided herein is for informational purposes only. There is no guarantee that these statements, opinions or forecasts provided herein will prove to be correct. Past performance is not a guarantee of future results. Indices and peer groups are not available for direct investment. Any investor who attempts to mimic the performance of an index or peer group would incur fees and expenses that would reduce returns. No investment strategy can guarantee success. Economic and market conditions are subject to change. Investing involves risks including the possible loss of capital.
The information has been obtained from sources considered to be reliable, but we do not guarantee that the foregoing material is accurate or complete. Diversification and asset allocation do not ensure a profit or protect against a loss.
